Instagram The Dam!
Social Media Mining becomes a quick and handy tool for architects and urban planners to ask: “what’s going on here?”. In this blog, we looked at how designers can use this handy tool to paint a more detailed portrait of our popular urban hot-spots. To demonstrate, we examined 4 recreation destinations: Marineterrein, Pllek, Westerdok and Sloterplas in and around the waters edge of Amsterdam.
Thanks to Aurore Paligot the very talented Data Scientist and Story Teller.
n°1 - Popularity of Place
As an architect and urban planner, I’ve always missed the feedback loop from real people in real locations. What are people saying about our public and private spaces? Social Media Mining becomes a quick and handy tool for architects and urban planners to ask: “what’s going on here?” In this example we mined Instagram ‘Likes’ to compare which urban beaches in Amsterdam were most popular and why.

n°2 - Spatial Discussions
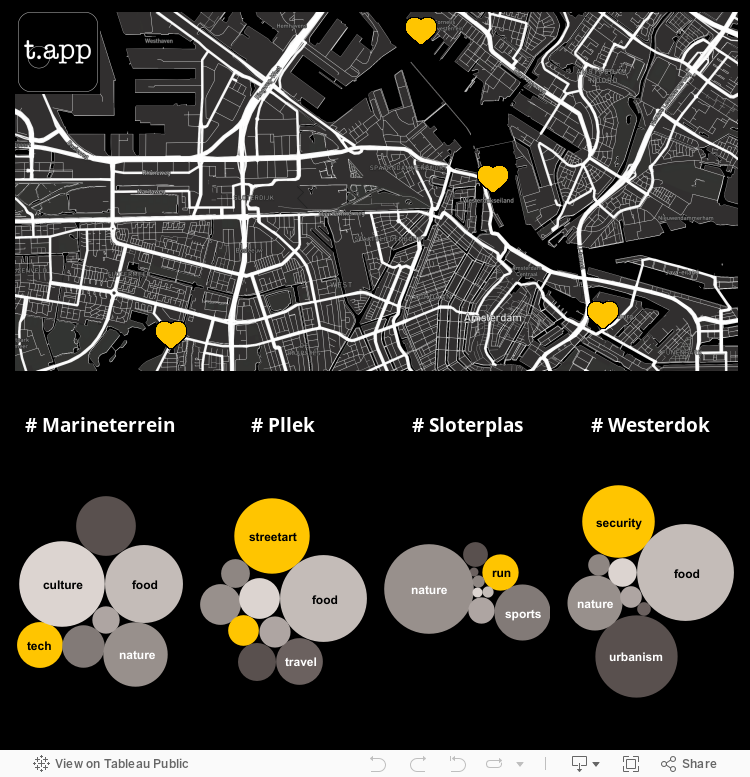
The Marineterrein is not just an Urban Living Lab, it’s also a popular destination for Amsterdammers to cool off during the hot summers. Social Media Mining is a handy tool to paint a more detailed portrait of our popular urban hot-spots. For example, when comparing hashtags like #Marineterrein we start to see how the posts relate directly to the perception of #tech and shared topics like #culture #food #nature #urbanism.
n°3 - Social Sentiment
Our urban experience is no longer limited to the physical or spatial surroundings. In this exploration of Amsterdam Urban Beaches, we use Social Media Mining to dig deeper into the various layers of each location through the lenses of association and sentiment. For example Marineterrein, we see a strong association with #Technology, where in Westerdok there is very active community in #Security. What do these hashtags suggest about these urban hot spots?

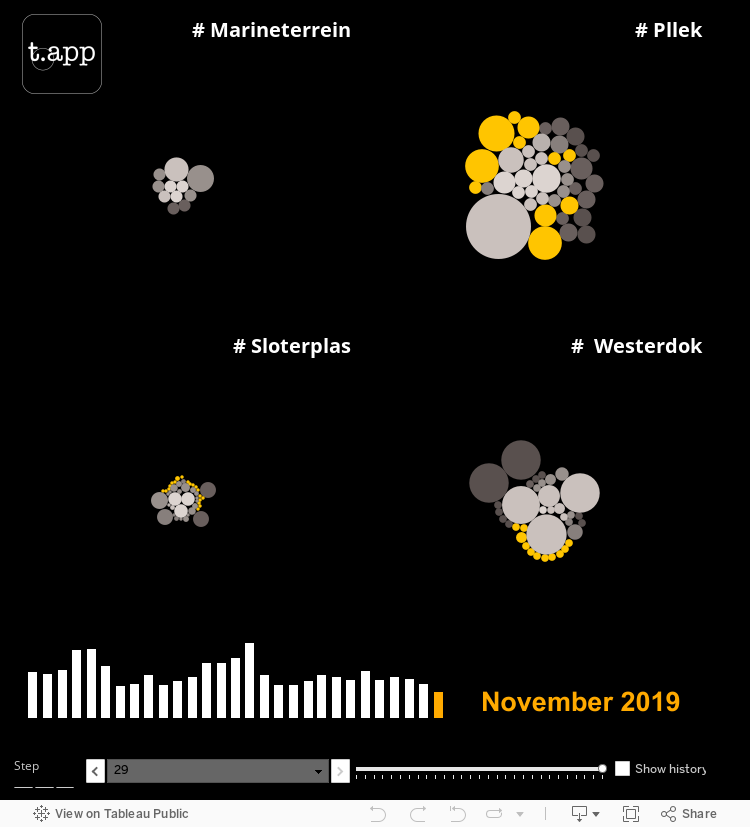
n°4 - Public Perceptions
The popularity and frequency of a place can be measured through time by looking at its online popularity. The fluctuations of social media posts become a good indicator of what’s attracting people to a certain place and when. Overtime these hashtags can show us how public perception of our places and buildings have changed.
KEY: Yellow circles are specific themes to location characteristics. Grey circles are other themes associated with the location. The size of a bubble is proportional to total number of hashtags